
Introduction
In today’s data-driven world, smart buildings generate massive amounts of information every second—energy usage, equipment performance, occupancy, comfort levels, and more. But raw data alone doesn’t create value. The real power lies in transforming this information into actionable insights. That’s where building automation dashboards play a critical role. A well-designed dashboard empowers facility managers, building owners, and executives to monitor performance, detect inefficiencies, and make informed decisions immediately.
This blog explores best practices for building dashboards that not only display data but also drive real results.
Focus on User-Centric Design
Not every stakeholder needs the same level of detail.
- Facility Managers need granular, real-time metrics like HVAC runtimes, alarms, and equipment efficiency.
- Executives prefer high-level KPIs—energy cost trends, carbon savings, and ROI metrics.
- Tenants may value comfort-focused data such as air quality or temperature consistency.
Best practice: Segment dashboards by user type to ensure relevance and clarity.
Highlight Key Metrics, Not All Metrics
One of the most common mistakes in dashboard design is information overload. Instead of showing every available datapoint, focus on KPIs that align with business goals.
Examples of impactful metrics include:
- Energy Performance: kWh consumption, cost per sq. ft, peak demand.
- Operational Reliability: Equipment uptime, maintenance backlog, predictive maintenance alerts.
- Sustainability Goals: CO₂ savings, renewable energy usage, water consumption.
Best practice: Use the 80/20 rule—focus on the 20% of metrics that deliver 80% of the insight.
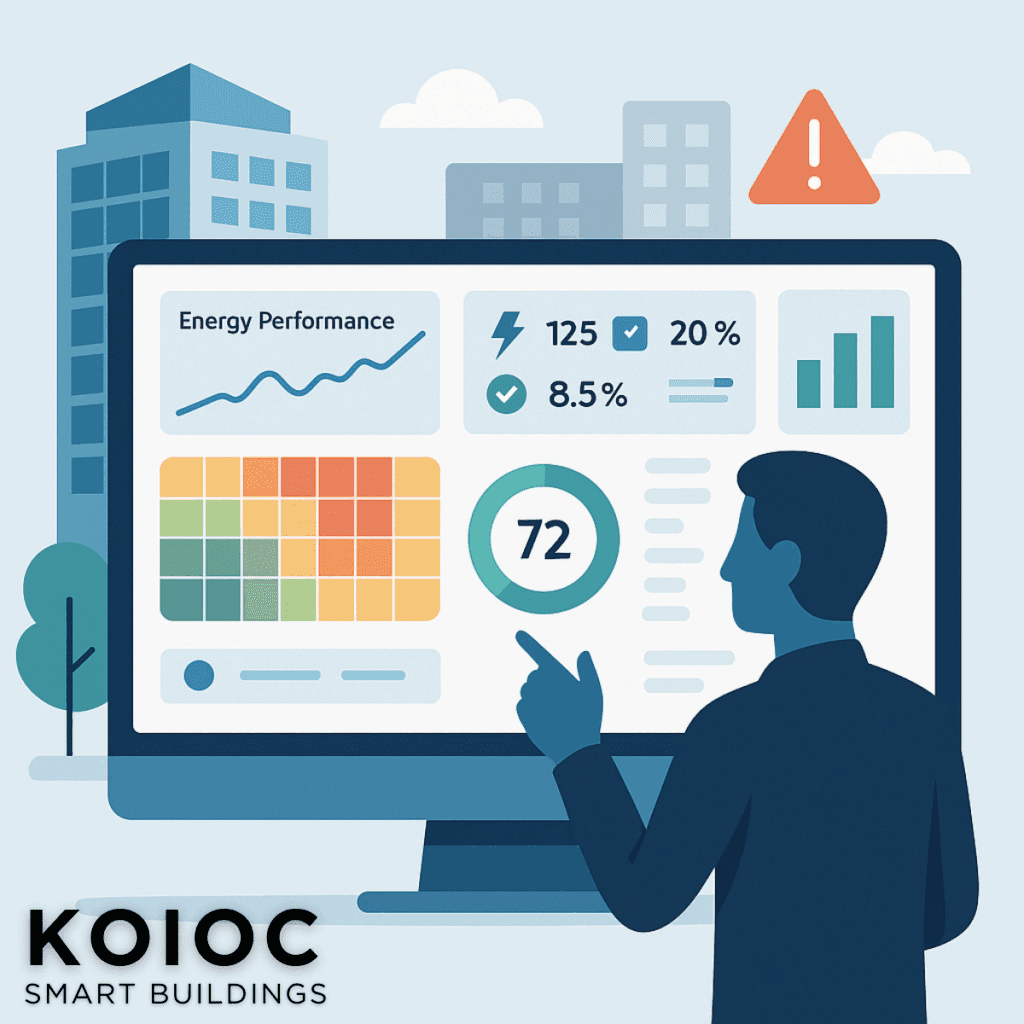
Use Visuals That Tell a Story
Numbers alone rarely inspire action. Clear visuals—such as trend lines, heatmaps, and benchmarks—help translate complex data into easy-to-grasp insights.
- Trend lines reveal energy performance over time.
- Heatmaps highlight inefficiencies across zones or equipment.
- Comparative benchmarks show how one site or system stacks up against others.
Best practice: Ensure visuals answer the “So what?” question—what does this data mean and what action should follow?
Enable Real-Time Monitoring & Alerts
Dashboards should not only reflect the past but also react to the present.
- Real-time monitoring ensures that anomalies are caught as they happen.
- Automated alerts notify managers when systems exceed thresholds—before they spiral into costly issues.
Best practice: Combine dashboards with predictive analytics to shift from reactive to proactive management.
Keep Dashboards Simple and Intuitive
A dashboard should never require a manual. Avoid clutter, use plain language, and keep navigation intuitive.
- Use color coding (green = optimal, red = issue) for quick recognition.
- Limit screens to essential widgets, with the option to drill down for details.
Best practice: If a user can’t grasp the dashboard’s story in under 30 seconds, it needs refinement.
Align Dashboards with ESG and ROI Reporting
With growing emphasis on sustainability and accountability, dashboards should help track ESG performance and financial outcomes.
- Showcase energy savings tied directly to cost reduction.
- Highlight environmental metrics (CO₂ avoided, renewable integration).
- Provide export-ready reports for stakeholders and compliance.
Best practice: Use dashboards as a bridge between operational efficiency and executive decision-making.
Conclusion
The true value of a building automation dashboard lies not in the data it displays, but in the actions it inspires. By focusing on user-centric design, key KPIs, clear visuals, real-time monitoring, and alignment with broader goals, dashboards become more than just screens—they become strategic tools for smarter, greener, and more profitable buildings.